Article
Issue #181 | Meta’s Ads Got Cheaper. That’s the Problem

There’s a post from Peter Quadrel that’s been making its way around X and LinkedIn that dives deep into why it feels like every other post on IG is an ad. The accompanying chart (included below) brands this the “Saturation Gap”:
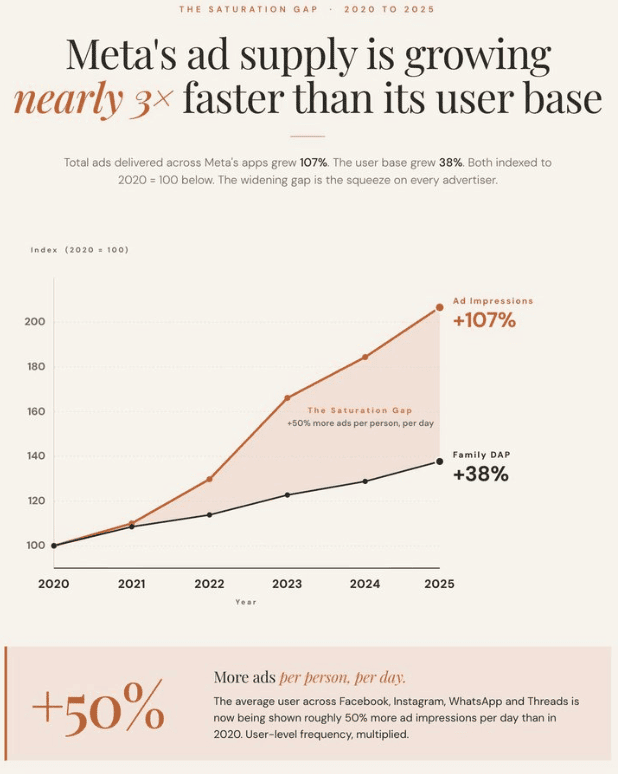
The chart does a fantastic job of illustrating the supply growth on Meta over the past ~5.5 years. It indexes both number of impressions and number of daily users to 2020 = 100, then plots Meta’s reported growth in both. The end result is a wedge – users grew only 38%, while ad impressions increased 107% across the entire Meta ecosystem.
The data is bang-on the money: implied year-over-year user and impression growth tracks Meta’s 10k reports; the conclusion – that there are ~50% more ads per person, per day – aligns with both our data and my perception as a user of both platforms.
But, despite all of these numbers being right, something still felt off when I read the post and studied the chart: it argues about costs, but never plots the price.
Let’s Start With The Basics
For any ad platform, revenue (at least, ad revenue) can be calculated using a simple equation:
Ad Revenue = (Impressions Served / 1000) x CPM
We know (from Meta’s own regulatory filings) that platform ad revenue increased from $84B (2020) to $196B (2025) – a 133% increase. Over that same period, impressions rose 107%.
Divide one into the other, and price per impression rose 12.7% over 5 years, against a cumulative CPI of ~23%. That means, in real terms, Meta’s ad prices fell about 9%. That’s not the story I see anyone talking about, but it’s undeniably correct in financial terms. Ad units are cheaper on Meta today (on an inflation-adjusted CPM basis) than they were in 2020.
The net/net of this is that Meta manufactured inventory faster than demand showed up, then passed advertisers the discount created from the supply glut it created. If Meta wanted to increase CPMs, it only had to hold supply constant and let the auction run – but it chose not to (and honestly, that choice was probably pretty savvy).
You can decompose this as follows:
Revenue = Daily Users x Impressions Per User x (CPM/1000)
If you express this in logs the shares sum to 100% with no residual and no interaction term:
Δln(Revenue) = Δln(DAP) + Δln(Ads per Person) + Δln(Price per Impression)
If you plug in the exact values from above, you can see that ad load per person = 48% of Meta’s revenue growth; User growth = 38%; Price = 14%.
Almost half of Meta’s 5-year revenue story is dilution. Meta grew by cutting the same attention into more slices and selling each slice at slightly less than the old price (in real terms). That is a supply expansion, and from the buy side supply expansions are supposed to be good news.
The Unreported 69% Price Hike
One of the most common retorts to claims that the price of goods today has declined is to pivot to quality (the old “they just don’t make ‘em like they used to” argument we all hear from our parents/grandparents). Honestly, the point is valid – so valid, in fact, that economists have developed a method to handle quality when calculating CPI.
Statisticians hedonically adjust prices: a 2025 MacBook Pro selling for $1,799 (the same price as a 2020 MacBook Pro, ironically) is actually recorded as a price cut, because the customer gets far more processing power / RAM / capability for the same nominal price (the real price is actually lower because of inflation, but who’s counting?)
We can apply that same method – albeit backwards – to Meta’s ad units:
Attention per person on Meta is close to flat. Time spent grew modestly over the period in question thanks to Reels (call it +10% to be charitable). Impressions per person rose 50%. Divide attention by impressions and every individual impression now carries about 34% less human attention than its 2020 equivalent.
End result = advertisers on Meta are paying ~12.7% more (in nominal terms; ~9% less in real terms) for an ad unit worth 33% less. That is a 69% attention-adjusted price increase.
That’s the statistic we should all be talking about – and figuring out what to do about it.
I have a few thoughts:
Creative is A Constraint, Not THE Constraint
If you spend any amount of time at industry events, webinars, X or LinkedIn, you’ve probably heard smart-sounding media buyers confidently proclaim some variant of “creative is the constraint” or “just make more creative, stupid.”
I’ve found that most people arrive at that conclusion via either intuition or imitation; relatively few take the mathematical route. And therein lies the problem – if you don’t understand the why behind the intuition, you don’t understand the limits of the intuition and you end up making mistakes.
Let’s start here: attention is not the objective of advertising. Neither brands nor agencies are paid in attention; we’re paid in sales or leads or users or whatever.
Fundamentally, that means when you buy an ad on Meta (or YouTube, or AppLovin, or Snap), what you are buying is revenue per unit of attention purchased. That decomposes the same way everything else does:
Revenue / impression = (attention / impression) x (qualified attention / attention) x (revenue / qualified attention)
In order, we can term those parentheticals hook, relevance & extraction.
To be blunt, anyone can raise the “Hook” term: just throw in some sensational/rage-bait creative and watch it go up-and-to-the-right … while also destroying the value of the relevance + extraction terms. Since Revenue/Impression is a product, raising 1 component 200% but decaying the following 2 by 50% each actually reduces total value by 25%. In Ads Manager, that looks like a spectacular hook rate, while CAC goes through the roof. Attention from the wrong person converts at ~0%, and attention from the right person converts at a level far below where it should if the LP, offer and/or post-conversion process (checkout, lead follow up) fail.
I find this structure helpful because it allows you to prioritize the levers you have (as a media buyer or CMO or marketer) to pull:
- Bidding does not move the price level, which is set via aggregate supply. But, depending on which strategy you use, it may not be idle, either: a cost cap sizes every bid against predicted value, which makes it a filter on relevance: you buy the impressions the model expects to convert and decline the ones it does not
- Targeting operates primarily on the relevance term
- Post-click dominates on extraction (and this term itself is a product of LP experience, offer, nurture/post-conversion experience)
- Creative is dominant on the hook, with a strong influence on relevance – Meta has confirmed that creative selects the audience more reliably than audience settings do thanks to Gem, Lattice and Brain.
So creative is the largest lever available and the one the platform-level data says moved, but it is a constraint, not the constraint. If you’re treating creative as the entire answer, you’re making the same error as that chart.
In fact, if you take this approach and map everything back together, you’ll get something that looks quite familiar: Hook is (essentially) Hook Rate. Relevance is (essentially) CTR. Extraction is CVR x AOV. This is why the CAC decomposition and this one are the same instrument pointed at different ends of the same interaction.
While I’m correcting things: “scaling gets harder” collapses 2 different problems into one sentence: a 107% supply expansion flattens the response curve, which means more room to spend before diminishing returns hit. Volume got easier. Holding CAC flat(ish) while you capture that volume has become far more difficult. Those are fundamentally different problems with very different fixes; conflating them is how brands end up buying their way out of a creative failure.
OK. So What Can I Do With This?
The easiest thing you can do – right now – is add a real price series in your reporting, which you can do in ads manager using custom metrics.
Let’s start with the basics: CPM prices the container. We want to know the cost of attention, then the conversion rate on attention to money (or money-adjacent) stuff.
Create a new custom metric:
Cost Per Second of Attention = CPM / (1000 x hold rate x avg watch time (s))
That’s the “cost” of the contents that go into the ad container you bought.
But cost is only half the story; the other half is what you got for that money (e.g., what that attention translated into):
Revenue Per Second of Attention = Revenue / (impressions x hold rate x avg watch time (s))
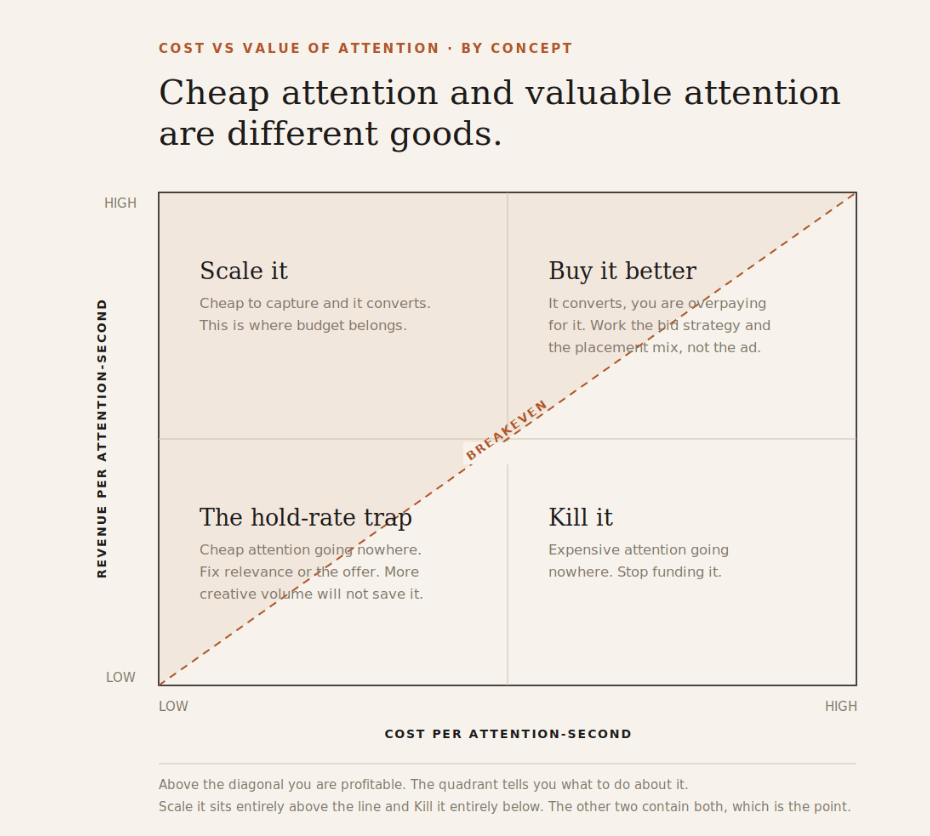
Your immediate reaction might be to make a ratio of the 2. Please don’t. If you actually do the math, this just reduces to ROAS with a few more steps, which is not exactly revolutionary. Keep the 2 as separate series and plot them against each other by concept. That produces a nifty 2×2 matrix that can help you make better decisions (h/t to Claude for the design help!):
Next: run creative supply through Little’s Law:
Concepts live in market = launch rate x avg lifespan.
The best way I’ve found to calculate lifespan is days from launch until daily spend at or below target CPA falls to 50% of peak.
If your half-life dropped from 40 days to 20, you need 2x the creative production to maintain the same number of ads (if you’re not sure how many ads you need, I covered the math behind that here). What’s fantastic about this is it produces a target a creative team/agency can be held to and a creative budget you can actually defend – which “just make more ads” has never been.
Finally: re-size your budget. If ad load per person rose 50% (which is about right), then holding share of voice flat requires 50% more impressions. A flat budget at flat CPMs is – mathematically – a 33% decline in share of voice. If you bring that math to your CMO/CFO, you can actually (and credibly) make the argument that maintaining your 2020-2021 performance requires more budget, based solely on platform economics and realities. I can’t guarantee they’ll be receptive to that, but I’ve had exceptional success with it.
Check Your Underlying Placement Distribution
The 12.7% increase in price per impression is blended and global. Simpson’s Paradox exists for a reason. Based on Meta’s own 10-K disclosures, impression growth skewed toward Rest-of-World geographies and toward new, cheap surfaces (e.g., Reels, Threads). The average is weighted by exactly the inventory that drags it down.
If your CPMs are up meaningfully more than 13%, that is a surface and geography mix story far more than it is a story about systemic auction failure. The best course of action if you find CPMs are up 20%+ is to pull the placement + geo breakdowns first. Most of the time, you’ll find delivery drifted into cheap placements. That resulted in CPM and CVR falling together, which (probably) resulted in everyone concluding either (a) we need more creative STAT or (b) the LP experience was terrible, when neither of those was the actual problem.
What Doesn’t Change + What You Should Do
Meta can manufacture placements forever (seriously, I remember the semi-rhetorical conversations in 2020 about how many more ads Meta could possibly show) – Threads ads, WhatsApp Status, whatever Zuck contrives to make more money in 2027. Each one is real inventory and each will price attractively at launch, because that is what a supply expansion does.
What Meta cannot manufacture is hours in the day or dollars in a bank account.
Inventory is elastic. Attention is not. Consumer discretionary funds are not.
So, instead of worrying only about CPMs, worry about attention + conversion of it to something valuable to your business (or your client’s business).