Article
Issue #182 | The Tampering Tax

Between audits, pitches and a truly unreasonable number of 2027 (yes, really) planning meetings over the past few weeks, it’s been a maniac start to the fall.
From all that, 2 meetings stand out – both of which featured different versions of the same argument, both of whom would tell you (sincerely) that they run a tight operation, both of which have the same problem.
Brand #1 is a B2C lead gen company that wants changes hourly. Not daily. Hourly. All based on call center volume and booked appointments. If the phones are quiet at 10 a.m., push more money into Google; if the dialers are too busy at 2 p.m., pull it back. The brand wants to run the entire almost-7-figure account using a signal that has very little to do with anything in the Google auction + quite a lot to do with who’s at lunch.
Brand #2 is a relatively well-known-but-niche eComm brand. Their founder mentioned on the discovery call they are paying north of $10k/mo for CRO. He mentioned the agency has been making changes weekly to the site, PDPs + checkout. The brand has an AOV of ~$3,000, 200-250 sales/week, overall brand is doing ~$35M/yr. It’s – by most measures – a very good business. And it’s the quality of that business that makes the weekly changes indefensible, because at that volume any report/dashboard/changes (whatever) can’t pick up a anything worth seeing.
I’ve written before that overmanagement is the first deadly sin of ad accounts, and in Day Trading In Paid Media I argued that most of us were never any good as day traders to begin with. Those were arguments. Today, I’ll show you the math behind that argument.
Small Numbers Lie In A Very Specific Way
Conversions – whether they’re leads, sales, demos, chats, sign-ups, whatever – are counts. Counts of independent events occurring at a stable rate follow a Poisson distribution. Poisson carries one property that should have reorganized how this industry schedules its work about 20 years ago: The standard deviation of a count equals the square root of its mean.
An account averaging 20 sales/week has a standard deviation of 4.5 on that count. That’s a 22% coefficient of variation baked in before anyone touches anything, before a competitor makes any changes, before creative fatigues, before Google changes whatever the wonderful people running their ad product decide to change this month. For that account, a week with 13 sales + a week with 28 are both “normal”.
It gets worse when you do what everyone actually does, which is compare those 2 weeks above. When you do, you’re differencing 2 noisy numbers instead of reading 1. For 2 windows that each expect N conversions, the standard error on the relative difference between them runs about the square root of 2/N – so at conventional (95%) significance and 80% power, the smallest change you can separate from nothing is:
Minimum detectable change ≈ 4 ÷ √N
Flip it around for the version you’ll use: to resolve a change of size δ, you need roughly 16 ÷ δ² conversions per window:
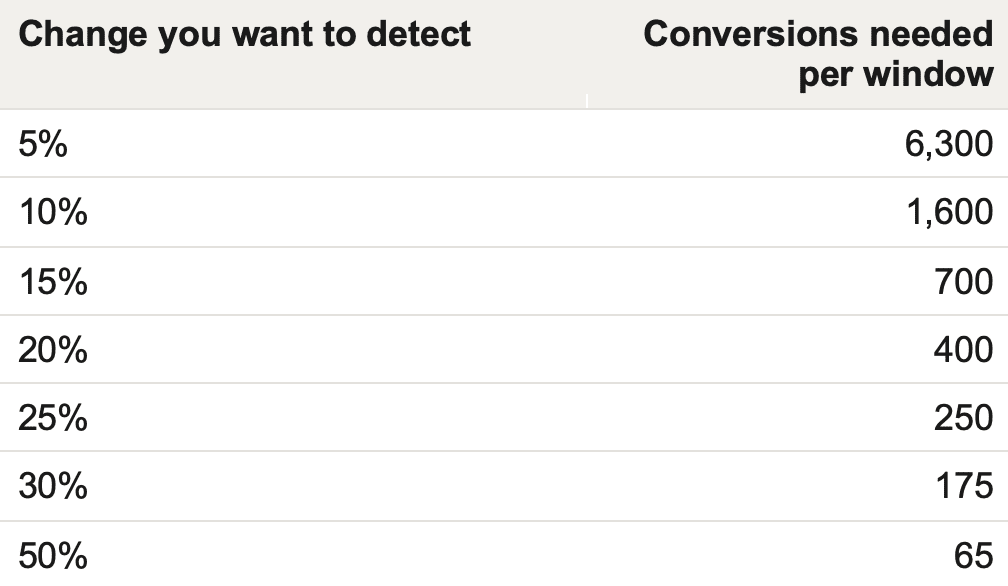
The top row probably doesn’t look like much – after all, 5% seems pretty small. But – for a brand doing ~$35M and trying to scale, a 5% shift can be material. Actually, seeing one requires ~6,300 sales in the observation window plus another ~6,300 in whatever you’re comparing it against. Very few companies have that in a month, let alone a week, which means very few people have ever observed a 5% change in anything over a weekly period. They’ve just inferred one from a bunch of noise.
What Do You Actually Get For $10k/mo of CRO
If you run the eComm brand through the math above. With ~225 sales/week, week-over-week resolves about 26%. Their entire range (200 to 250) sits inside the band a perfectly stable process produces on its own. If you overlaid a control band on the brand’s Shopify dashboard, the limits of “normal” are at 180 sales/wk and 270 sales/wk. And when you put it like that AND look at the brand’s weekly sales numbers (except BFCM + their summer sale event), 49 of 49 weekly sales numbers falls inside the control band. That’s the cold, mathematical reality. The system is noisy.
The testing math is equally brutal. The site’s median conversion rate is ~2.4%, so 225 weekly sales implies ~9,400 legitimate sessions, or 4,700/arm on a clean split. A 10% relative lift needs roughly 64,000 sessions/arm, which you won’t get unless you wait 14 weeks. A 5% lift needs 255,000/arm, which is a full year (it’s technically 55 weeks, but the brand does get a weeks’ worth of traffic of BF alone). On a weekly basis, that site can only ever resolve effects of 30%+, and effects that size aren’t optimization – it’s triage + repairs.
But even that conversion rate isn’t fixed. It varies between 1.3% in the troughs to 5.8% at BFCM, better than a 4x difference. You’d assume a swing that large moves the testing math substantially, since a higher conversion rate means that fewer sessions are required to detect a lift. In reality, it doesn’t – because a higher conversion rate also means fewer sessions per conversion, and the two effects cancel almost exactly. At 1.3%, a 10% lift takes 13.8 weeks. At 5.8%, 13.1 weeks. At the 2.4% median, 13.6 weeks.
Conversion rate doesn’t appear in the answer at all. Only conversion count does.
Whatever else is true about a site – traffic, user experience, category/industry, whether it converts at 0.5% or 6 – the time to detection is governed by how many conversions it produces. That’s it. Conversion volume is the name of the game, and most brands aren’t even looking at the scoreboard.
Seasonality does a different kind of damage: a test that needs 14 weeks is running across ~4 months, during which time the baseline can move 100%+ for reasons that have nothing whatsoever to do with the test. A concurrent randomized split addresses that, since both arms drift together (assuming they’re perfectly random). A sequential before-and-after doesn’t, but sequential is precisely what “weekly updates + changes” means in practice. Push the changes on Saturday morning, compare next week to last week, and try to divine whether the new version is better than the old one based on some tea leaves, hope and prayers.
Once we walked the brand owner through the math, he understood it…but kept coming back to the fact that the changes + reports “felt alive.” Something was always changing, and when it changed, the numbers went up or went down. He was right. The numbers were always moving, but they were moving for reasons that had nothing to do with the changes and everything to do with normal variation.
That’s not to say CRO was pointless. For this brand, a 5% improvement in conversion rate is worth ~$1.75M/yr (assuming constant traffic quality + volume). That’s a chunk of change. It makes CRO one of the most valuable things this brand could invest in –but based on the site’s traffic, a change of that magnitude is undetectable inside of a year. The effects big enough to see week-over-week are too rare to build a program around, while the effects worth real money (those 5% lifts) are invisible at the interval they’re optimizing around (weekly).
Deming’s Funnel + The Hourly Account
Brand #1 (the B2C lead gen account that wanted daily management based on call center volume) fails differently (and arguably worse) because it isn’t merely underpowered; the account is structured to manufacture the variance it’s reacting to.
Based on their data, they averaged 4 booked appointments/hour. Poisson standard deviation of 2, control limits at 0 and 10, roughly 9% of hours producing 1 or fewer appointments and about 5% producing at 8+. Across a normal 15-hour day (call center opens at 6 am, closes at 9 pm) with nothing changing anywhere, the brand should expect one alarmingly quiet hour and one suspiciously strong one. Their intervention rule fires on both. So, they intervene 2-3x per day, every day, forever, and every one of those interventions is a response to nothing at all.
W. Edwards Deming demonstrated what this does with a funnel and a marble. Drop marbles through a fixed funnel aimed at a target and the scatter has some variance – call it σ². Now adjust the funnel after each drop by the size of the last error, in the opposite direction, which is exactly what any attentive, well-intentioned, hard-working operator does, and variance doubles. If, instead, you move the funnel to wherever the last marble landed, you get a random walk with unbounded variance, wandering permanently around the target it was built to hit.
Brand #1 is running Deming’s 2nd rule against a Poisson process. A meaningful share of the variance they’re reacting to is variance they created, which they then react to, which creates more variance.
The compounding problem is that every intervention drops a structural break into the time series. An account with 10 changes/day has no stable stretch long enough to measure anything, which means it can never accumulate the observations that would tell anyone whether any of the changes worked. Intervention frequency and statistical resolution trade against each other directly. Every change resets the count (and, as we saw above, the count is what matters). A manager who changes something weekly will never observe a monthly effect.
Finally, there’s the sensor itself, which is its own category of error. Call center volume + booked appointments are downstream, capacity-constrained + staffing-dependent. Those two things are as much measures of the people answering the phones as they are of the media driving the phone calls. Connecting spend to it results in a loop that confirms itself: bookings looks soft because one of the call center staff took their 15-minute break. That results in budgets being stepped down, which means fewer bookable calls, which means appointments booked drop. The intervention manufactures the change.
Why Nobody Stops
These two examples always invite the same question: if this is so obviously suboptimal, why do successful brands and smart media buyers keep doing it?
The answer: regression to the mean + apophenia (the wonderful bias of seeing meaningful patterns in random data).
Here’s an example: a few days ago, the brand had a TERRIBLE hour. 1 bookable call, no appointments booked. Reaction? Intervene. Pump up budgets. Increase tCPAs. Push more spend. And what happened during the next hour? Calls + appointments reverted to the mean, because that is what a mean is. But what happened after that mean reversion? The intervention took the credit. There’s a phrase for that in Latin: Post hoc ergo propter hoc. “After it, therefore because of it.”
The only problem is that it’s almost never true.
Appointments booked didn’t increase because of the change, they increased because of a mean reversion. But (thanks to apophenia), the client doesn’t see that; they see a save. An intervention was followed by an uptick in performance, therefore the intervention caused the uptick.
Result? The “intervene” behavior is reinforced, the trigger to intervene becomes more sensitive, you catch more bad hours, you generate more saves….and you accumulate more evidence for a causal story that the underlying process guarantees would have appeared whether anyone touched the account or not. This is how a brand ends up with a change log longer than War & Peace, an impressive internal narrative about responsiveness, and a flat account.
The good news is that this is testable via 2 audits, which can you accomplish this afternoon:
- The recovery test. Pull 12 months of change logs. Tag every period as intervened or not, then compare what happened after an intervention against what happened after a comparable low point where nobody touched anything. If your interventions carry information, the intervened periods recover faster or further. If both groups revert at the same rate, they were the same distribution all along, and your change log is a record of activity rather than a record of value.
- The tampering rate. Count what share of the account’s interventions (from the first test above) were triggered by performance that sat inside the control limits. That percentage is your tampering rate. For most accounts, that rate is far higher than you probably want to admit.
OK, So Now What?
The solution isn’t “look less often.” Nobody is going to do that, and nobody should. It’s to stop running 3 completely different activities off a single calendar.
- Monitor continuously for breakage, not performance. Tracking failures, disapprovals, feed errors, depleted budgets, wrong ads, broken pages, broken checkouts, whatever. Daily is fine. Hourly is fine. These are step changes rather than rate changes, so they’re detectable instantly at any volume because they’re enormous, and they are the only category of thing a glance can legitimately catch.
- Full Send, All The Time. New creative, new angles, new landers, new offers. Each one is an option, the incremental cost of each option is exceedingly low and the payoff distribution is long-tailed. Nothing here argues for slowing production down. Ship fast, judge slow.
- Set Evaluation Frequency Based On Data. Establish the threshold first: what is the smallest change that would actually cause you to do something differently? For most budget decisions, the honest answer sits between 10% and 20%. Take 16, divide by that threshold squared, then divide again by the conversions you produce per period (not your conversion rate which doesn’t enter the calculation at all). The result is your review window.
If we put those numbers to the accounts from above:
For the eComm client at a 10% threshold: 1,600 conversions, a little over 7 weeks. For the lead gen client at 20%: 400 conversions, which is a week. Justifying an hourly evaluation rate at that threshold would require ~400 conversions per hour, which is 1.4M/yr. They are nowhere close to that.
If you must watch something, create a dashboard with a control chart and leave it alone. Center line at the mean, limits at 3 standard deviations, which for count data is just the mean plus or minus 3 times its square root. A point outside the control limits is a signal. A series of 8 consecutive points on the same side of the center line is a signal too (<1% chance in a stable process). Everything else is noise.
For a seasonal business, recompute the limits by period instead of fitting them once across the year. A site converting ~2.4% for most of the year and 5.8% at BFCM isn’t one process behaving erratically. It’s 2 processes, and the transition between them is an assignable cause worth acting on.
None of this is an argument for ignoring change. It’s the only reliable way I know to tell change from the appearance of it. Shewhart’s actual point, back at Western Electric in 1924, was that a stable system doesn’t improve when you react to it; it improves when you change it structurally. Knowing which situation you’re in is a prerequisite for doing either one well. We’ve spent 25 years building dashboards that refresh every 15 minutes and roughly 0 days teaching anyone to read a control limit.
2 Objections If I Wanted To Argue With Myself
The world does change inside a 7-week window. Seasonality is real – the client above watches its own conversion rate range from 1.3% to 5.8%. Competitors enter. Offers change. Platforms make changes that impact CVR + CPA. Budget run out. Tariffs happen. Markets rise and fall. Consumer sentiment waxes and wanes. But the response to drift shouldn’t be shortening the window until you can’t see anything; it’s should be removing the drift from the comparison. Random split tests, matched geos, holdouts, YoY indexing all do that. They allow the counterfactual to carry the seasonality so your comparison doesn’t have to.
Everything describes observational comparison, which is what a weekly report is. A properly designed experiment does better (sometimes much better) through variance reduction, covariate adjustment and/or sequential methods that let you stop early when an effect is large. That’s an argument for building experiments instead of staring at a time series – resolution is a design problem, not a frequency problem. Sampling more (i.e. watching the account hour-by-hour) will never tell you when something is off.
What none of it supports are the arrangements I opened this issue with, where a business doing ~$675,000/wk in revenue pays an agency to change stuff weekly in response to sales numbers that fit inside control limits or a brand wants a team to steer media by the ambient noise of a call center.
Change rate isn’t something to negotiate as part of a contract; it’s a property of the brand/account that you can compute, so just compute it.