Issue #170 | Your CPL Is Lying To You

This issue was the result of one member of my team asking why I started asking the same question in every client onboarding, audit and candidate interview: what’s the gross margin on the product or service you’re advertising?
It’s a deceptively simple question – yet (maybe) 1-in-10 people answer it correctly.
Gross margin. The percentage of revenue that remains after the direct costs of delivering the product or service. The number that determines whether a “profitable” campaign is actually contributing to the business (i.e., generating excess capital available for SG&A, rent, interest, profit, whatever), or merely has the appearance of being a contributor. Basically: is your campaign/channel/platform/whatever a profit center or a cost center?
I’ve now asked this across hundreds of agencies, candidates & brands in legal, senior living, home services, eComm/DTC, SaaS, financial services, education – you name it. Every one has different cost structures + revenue sources + business models, but the common thread is that the vast majority of marketers working in each industry don’t know the answers.
This is the single biggest disconnect in marketing: the people managing ad budgets don’t understand the economics of the customers/leads/whatever they’re investing in with those dollars.
What That Looks Like in Practice
I want to share a real (anonymized) example from a B2C home services brand, just to illustrate exactly how this knowledge gap creates problems.
This org’s agency was over-the-moon about a $175 cost per lead in a campaign they had launched 3-4 months prior. This represented a substantial (~40%) decline in CPL vs. what the organization had previously obtained, and on that basis, the agency deserved credit – they did reduce CPL materially.
In listening to the call, one recommendation made on the heels of this success was to pause a different campaign, which was generating leads at an average of ~$405. Their rationale: the “new” campaign is performing materially better, and pausing this campaign would allow the new campaign to generate an incremental ~130 leads vs. the “underperforming” campaign (Campaign B had a monthly budget of ~$40,000, and generated ~99 leads from that budget. Shifting that full budget to Campaign A would produce 229 leads, assuming the CPL holds – an increase of 130 leads).
To 95% of marketers (and 100% of the people on this call), that recommendation sounded like a logical, rational, data-informed decision.
But the only reason that’s the case is because no one on the call had ever asked the question I began this issue with: what’s the gross margin?
It was, however, the first question I asked. Getting the answer took some work – we had to convince the CFO to let us pull data out of the CRM, then join that data with website form data (so we could get campaigns for each one), then go back to the CFO to get the material + financing costs (you didn’t really think the 3 years no interest offers were free, did you?), then do some analysis.
Once that was done, here’s what the actual P&L looks like underneath those two campaigns:
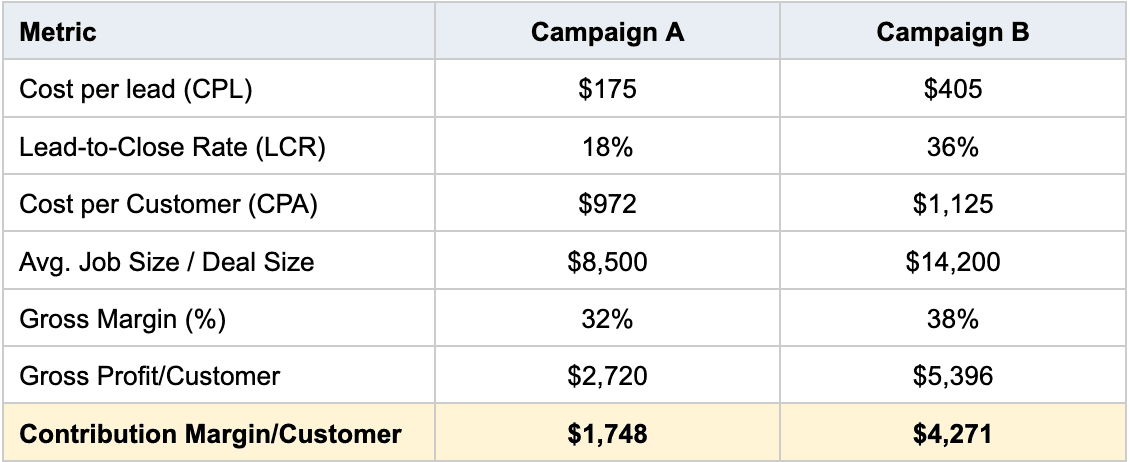
By the metrics the agency cared about / optimized for (CPL + CPA), Campaign B is dramatically underperforming Campaign A. It isn’t even particularly close – 15.7% higher CPA, 131.4% higher CPL. Those are big gaps in a high-volume lead machine. Yet, when you re-orient around what actually matters – contribution margin per customer – a materially different picture emerges: Campaign B nets 2.44x more contribution margin per customer than Campaign A.
The agency optimizing on CPL would have turned off the campaign that was generating nearly 2.5x more contribution margin, simply because no one thought to ask about the margin, then do the math.
Fortunately, this brand didn’t listen to that agency’s recommendation – but if they had, the cost from a contribution margin standpoint would have been massive: just over $80k/mo in lost contribution margin:
Campaign A = $40,050 in spend = 229 leads = 42 customers at $1,748/contribution margin per customer = $73,416 in contribution margin.
Campaign B = $40,050 in spend = 99 leads = 36 customers at $4,271/contribution margin per customer = $153,756.
This just goes to show that CPL + CPA aren’t everything – the quality of the customers matters, too. Sometimes the optimal path is to acquire more expensive customers – either because the margins on the things they buy are higher, or because they tend to stick around longer, or because the headaches they cause are far less frequent, or some combination of all 3.
Why This Happens
I’m a huge fan of Charlie Munger – and one of his pearls of wisdom is directly applicable to this situation: “I always say I want to know where I’d die so I can never go there.”
Translated to this situation: if you want to avoid making this mistake, you must first understand how the issue arises.
Let’s start with the obvious: agencies and in-house marketers alike optimize toward the metrics in the ad platform: CPL, CPA, ROAS. Those are the numbers that hit you in the face every day – when you open up Google Ads or Meta Ads, when AppLovin sends you a “quick campaign summary”, when you pull up your Shopify or Looker dashboard. They update in real time. It’s easy, fast, always-on. That accessibility creates the illusion of importance + reliability.
Conversely, the metrics that indicate whether a given platform/campaign/initiative is a net win or net loss for the business’ financial position (gross margin, contribution margin, LTV) are almost always somewhere else. Sometimes that’s in the accounting system. Sometimes it’s in the CRM. Sometimes it’s in a spreadsheet. Sometimes only in the CEO/CFO/COO’s head. Sometimes, it’s (quite literally) nowhere.
Getting those disparate systems connected is difficult, even in the age of AI. It requires talking to more people. It brings enhanced scrutiny (the first time a 57 year old CFO learns it’s possible to determine customer and channel-level profitability is what I imagine Aladdin felt when he first met the Genie). And half the time, the clearer picture of reality it provides makes your decisions/recommendations look quite dumb in hindsight.
Put another way: the incentives most marketers (in-house + agency alike) have tend to reward obsessing over platform-friendly metrics, vs. investing the time + effort (not to mention, risk) associated with uncovering that clearer picture.
The Deeper Problem Is Tradeoffs You Can’t Make
When your agency or marketing team doesn’t understand your unit/service economics, they can’t make optimal decisions to improve your business + maximize your return on your marketing/advertising investment.
They can’t tell you whether it’s worth paying 3x more per lead to acquire a segment with 2x the LTV. They can’t evaluate whether a higher CAC in one market is justified by stronger margins in that market. They can’t tell you that you should push more budget into a campaign with a lower ROAS – simply because the margins on those products are higher + the lifetime contribution margin is higher. They can’t tell you whether to defend a premium segment with higher CPL but better retention or chase a cheaper one with higher churn.
Every one of those is a real tradeoff our team has had to assess in the last month – and we were able to do it because we obsess about getting to the numbers that matter at the outset of the relationship.
And what ends up happening when you can’t is the example above: you end up making suboptimal decisions based on the illusion of complete information.
What You Actually Need to Know
Here’s what makes the example above possible: contribution margin per customer isn’t a number you look up. It’s a number you build. The recipe (usually) contains 4 inputs, all of which tend to live in different places. Here’s what goes into it – and, more to the point, the decision each input unlocks that the blended version hides:
Margin structure by offer, not a blended GM%. A 38%-margin package and a 22%-margin package bought at an identical CPA are not the same customer – but a blended margin number creates the illusion that they are. This is Simpson’s Paradox in the real world: blended margin gives you the average; it doesn’t tell you anything about the underlying distribution (which is what ultimately matters). Applied to marketing, a blended GM% will never tell you which campaign is feeding the profitable end of the mix. In the example above, a 6-point margin gap no one had bothered to examine made a massive difference in the overall contribution margin for each campaign.
Deal size by segment, not blended AOV. A blended average launders your best and worst customers into a single, lying number. Campaign B looked like the loser on CPA precisely because the blended lens couldn’t see it was buying $14,200 jobs while Campaign A bought $8,500 ones. Segment the deal size and the “expensive” campaign starts to make a lot more sense.
Close rate by source + segment. The same CPL is a steal at a 36% close rate and a catastrophe at 6%. Lead cost is meaningless in isolation – it only acquires meaning once you know what fraction of those leads are qualified, and what fraction of the qualified end up converting into customers. For almost every business, those conversion rates (qualification rate, lead-to-close rate) swing wildly by source. Optimizing CPL without factoring in qualification rate or close rate is optimizing the price of a thing while ignoring what the thing is worth. Once again, to modify a quote from the indomitable Mr. Munger: “A great lead at a fair price is superior to a fair lead at a great price.”
Net Present LTV by customer type. Let’s begin with the obvious: LTV is the most misunderstood (and poorly-used) metric around. Most agencies/brands calculate it by summing revenue over an “expected” lifetime (or worse, they assume customers will never churn), then treat that value as if it’s cash in the bank today. Nothing could be more damaging – not only does that calculation not take into account the cost of that revenue (gross margin!), but it doesn’t factor in the time-value of money. $1 today is not the same as $1 in 2030. Treating them as equivalent is a mistake that can have catastrophic implications. The right way to approach LTV is Net Present Lifetime Value.
A (Not So) Quick Explainer on Net Present LTV
Take the stream of contribution margin (not revenue) a customer generates across their actual, churn-adjusted lifetime, then discount each future period back to what it’s worth today. That’s the whole idea – and it’s all summed up in the name: Value, because you’re counting margin, not top-line; Lifetime, because it spans the relationship rather than the 1st transaction; Net Present, because $1 of margin you collect upon the first sale/deal is not the same as $1 you project you’ll get in month #22. The former is cash you can redeploy into acquiring more customers or paying salaries or buying more inventory now; the latter is $1 you’re hoping to get months (maybe years) from now – and it’s exposed to churn, default, inflation & everything else.
To convert that projected future contribution margin into today’s terms, you must account for all of the uncertainties that lie between today and that future date. In the finance world, we do that through discount rates. In simple terms, a discount rate bundles your cost of capital with a risk premium, to arrive at a percentage. For a well-capitalized enterprise during a normal economic period, the discount rate might sit near 10%. For an early-stage start-up financing growth on equity + expensive credit, with no guarantee the revenue ever shows up, 40-50% is often warranted.
All of that is consolidated into a single equation:

Where:
n = total number of time periods
t = specific time period
R(t) = net cash flow during period t
i = Discount Rate
C(0) = initial investment or cash outlay at time 0.
Apply this formula to every net cash flow (sale, expense, etc.) during the customer’s expected lifetime (purchases, subscription payments, COGS, Costs of Service, all of it), then sum the values. You’ll notice two things: (1) by counting all cash flows (including expenses associated with revenue), this LTV is true value – not just revenue, but contribution margin and (2) the further out and less certain the cash flow, the lower the present value. Intuitively, that should make sense: “value” should be the net of what you get (not the gross) – and the further into the future you’re projecting, the more variables and uncertainties there are, the less certain you are of realizing that future contribution margin.
To illustrate the power of this approach, run 2 cohorts that look identical on undiscounted LTV through this and watch the divergence:

Identical $3,600 lifetime contribution margin, with the same 25% discount rate – but Cohort A is worth ~52% more in today’s dollars ($800/customer).

And, if you go one step further and apply different discount rates based on projected behavior (for instance, because B2B SaaS customers on a credit card with fewer than 5 seats churn at a ~3x greater rate than enterprise customers who pay up-front, or weight loss program customers who pre-pay for a year in advance tend to stick with it far more than those who sign up on $0 down / $50/month intro offers), the picture gets even more stark:


As you can see from the table (and pretty bar graph, courtesy of Claude) above, the gap between the 2 groups widens from 52% to ~80%.
This happens because raw LTV (aka the LTV calculation 95% of brands/orgs use) is blind to when and how likely it is that a customer generates contribution margin. Net Present LTV then becomes the true ceiling on what you can spend to acquire a customer, denominated in the only currency that matters to your acquisition investment: today’s dollars. Optimize against undiscounted LTV instead and you systematically overpay for the slow-paying, high-churn cohorts that appear healthy in a spreadsheet (or your TW dashboard), but starve the business of cash. There’s a reason behind the saying, “most brands die waiting for LTV.”
But if you discount the future properly, and you stop conflating revenue with value, and contribution margin today with expected contribution margin tomorrow, you end up with a much clearer picture of your business + your customers as they really are. For anything recurring or serviceable, this is where the case for “expensive” customers is won or lost: a customer who costs 3x to acquire, but spends 4x more and sticks around 2x longer isn’t expensive at all – in fact, they’re underpriced. They are the analog of the $405 leads from the example above – you want more of them, not less, even though they are more expensive.
None of this is exotic, and that’s the point. The reason agencies/brands don’t have these numbers isn’t that they don’t know they matter; it’s that no one owns assembling them while the systems where the pieces live don’t talk.
The solution is simple: address the ownership problem. Make assembling this number someone’s explicit responsibility. Once you’ve created the process, automate it (this is a wonderful use case for AI), then put it front-and-center in the places where you (and your agency) go every day. Import it into Google Ads (no, Google is not going to steal your business if you tell them your margins) and Meta. Pipe it into your reporting dashboards. If you want something to be used in decision-making, it must be clear, obvious and present in the places where those decisions are made.
Do that, and you’ll never have to worry about falling into the trap the agency mentioned at the outset of this article did – because you’ll have the data required to make the right decision for the business.
The Takeaway
Your agency or in-house marketing team doesn’t need to be your CFO. They do need to understand how money moves through your organization. They must understand both cash flow and how enterprise value is created, because that’s the ultimate purpose of everything marketing is meant to do: make the business more profitable and more valuable.
The teams that get this stop celebrating CPL drops and start celebrating contribution-margin growth. They stop pausing “underperforming” campaigns based on platform metrics and start pulling P&L data into the optimization conversation. They stop reporting on what the business spent and start reporting on what value was created for the business.
That’s the difference between marketing that looks good and marketing that makes the business better.
Cheers,
Sam